Melbourne: dozens of SUSY talks were scheduled for today, the PDF files are accessible under the yellow rectangles here... Please tolerate security warnings in your browser: it's a safe CERN. You may pick the newest ATLAS stop squark constraints...A few hours ago, the CMS Collaboration released five new papers, mostly about the search for supersymmetry. In general, you could say that they universally conclude that "we see nothing so far".
However, a more detailed review could lead you to think that this conclusion could be premature.
In a paper about \(\tau\)-events, both parts of Figure 6 show 4 events in a bin which is more than about 1.5 expected events but one doesn't lose sleep because of that.
Instead, I am more intrigued by another paper based on the 2011 data, one about top partners (which may be stop squarks or other particles preferring to decay to the top quark and something neutral enough, like Kaluza-Klein modes of a top quark moving in extra dimensions),
A search for the decays of a new heavy particle in multijet events with the razor variables at CMS in \(pp\) collisions at \(\sqrt{s}=7\TeV\)The paper had the decency not to say "we don't see any significant excess" in the abstract (this omission is rather unusual by itself) although this sentence does appear in the summary. But even though it is supported by some statistics and by some conventions about the significance, maybe it shouldn't have appeared at all.
Melbourne talk PDF version of the paper
Why?
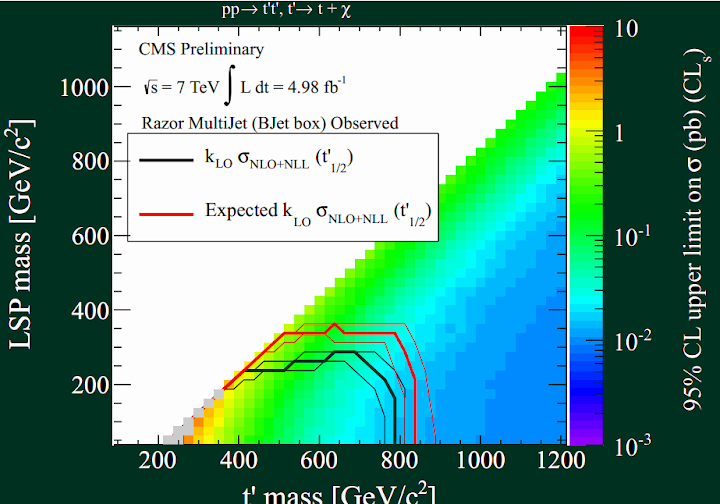
Let's look at Figure 3 on page 13 (one about the top partners) – although Figure 4 on page 14 (about gluinos) provokes a similar excitation.
Shift/click to zoom in.
They want to exclude a half-disk (near the bottom center of the graph) of possible masses of the top partner, on the \(x\)-axis, and the LSP i.e. the lightest superpartner it decays to, on the \(y\) axis.
Assuming that there's nothing there, they expected to exclude the region separated by the thick red (plus minus thin red) curve. Instead, they only excluded a smaller region bordered by the thick black (plus minus thin black) curve.
The error margins look a bit asymmetric and "discretized" on the picture but do you think that the black curve matched the red expectation within the red error margin? I don't think so. The black-bordered half-disk is clearly smaller than the red-bordered half-disk.
For example, cut the chart by a vertical line at the \(t'\) mass of \(550\GeV\). The expected lower bound on the LSP mass was something like \((350\pm 10)\GeV\). I chose the error margin as the compromise between \(0\GeV\) and \(20\GeV\). Instead, the observed lower bound on the LSP mass they got something like \((280\pm 20)\GeV\). The mean values differ by \(70\GeV\) or so which, if I understand the meaning of the error bars well, is either 7 times the smaller error bar or 3.5 times the larger error bar or 3.1 times the Pythagorean-combined error bar.
So I do think that if one looks at it from certain highly sensible perspectives, the chart shows a 3-sigma excess of certain events. One may conjecture that the CMS folks actually have a better way to see this excess and perhaps other excesses, too. I can even imagine that this analysis is the source of the stop squark rumors.
Well, there may be other analyses with similar bumps, too. This could be very interesting. Especially because I realize that the CMS' statistical committee contains some anti-new physics bigots (and I don't even have to name Tommaso Dorigo), I can't get rid of the impression that the somewhat excessively convoluted statistical Mike's Nature tricks in these papers were designed to hide the decline of the expected lower bounds on the masses.
Moreover, the things could be even more explosive for the very light top partners, in the partially censored left corner of the triangle. The boxes get orange if not very red over there, i.e. interesting. However, you see that the points very close to the diagonal have an undefined color, namely grey. The end of the caption under Figure 3 contains an explanation for this new color (well, my late grandpa, a painter, would surely correct me that grey is not even a color) which must surely elevate the adrenaline level of even moderate conspiracy theorists:
The solid grey region indicates model points where the analysis was found to have dependence on initial state radiation modelling in the simulation of signal events above a pre-defined tolerance; no interpretation is presented for these model points.In other words, the boxes were probably crimson like an Italian communist caught red-faced and red-handed while stabbing a discovery in its blood and gore under 5 meters of red wine he was drinking (I wanted to be accurate enough about the color) but we invented an "initial state radiation" excuse I've never heard of (look, we are able to describe an algorithm to screw our theoretical calculations for these boxes and the results are sensitive on the screwing! And make no doubts about it: the Google's #1 hit on "initial state radiation" goes to Dorigo's blog) to hide them by the grey not-even-color that no one can notice. So even if we have clearly found a \(300\GeV\) stop squark and a \(150\GeV\) LSP, no one will know. Moreover, Dr Heuer didn't allow us to interpret the red boxes, anyway. Of course, the reason to gray out those boxes could have been fully legitimate, too: it just seems right to me to be cautious here.
As Ptrslv72 correctly pointed out in the comments, the graph I reproduced above (the bottom part of Figure 3) talks about fermionic top partners, not bosonic ones such as stops. But the upper graph's story, one for the bosonic partners, is at least equally explosive. The same boxes are grayed out in it, too; and instead of excluding stop masses below \(550\GeV-2m_{LSP}\) or so which they expected (red line), the graph contains no exclusions at all (no black lines). This missing black line is easy to be missed – it looks like it shouldn't have contained one at all – and this invisibility may even be deliberate. The conflict caused by the missing black lines seems at least comparable to 3 sigma, too. Paragraph added later.
Note that this analysis is based on the 2011 data only. In the past months of 2012 themselves, CMS has already collected a greater number of collisions and they have a higher energy that may amplify similar significances by 20 percent or so. If the excess discussed above were real, it's plausible that the 2011+2012 data could be enough for a 5-sigma discovery by the CMS only. More likely, it could be ATLAS because Dorigo may gray out any CMS' discovery of SUSY. His CMS colleagues will surely thank him for killing their Nobel prize. But maybe he can't help himself: such a SUSY discovery would prove that he's been a giant and violent imbecile for many, many years.
And then there's ATLAS with the same number of 2011 and 2012 collisions, too. Things could conceivably get very interesting rather soon. Just to be sure, they are not obliged to. ;-) Note that this possible unnamed excess was publicized one day after the Higgs discovery. The time between the previous two consecutive discoveries of new elementary particles was somewhat longer than 1 day: it was 18 years. Experimental particle physics has sped up a little bit.
0 comments:
Post a Comment