The June 2012 anomaly was, much like the July 2011 anomaly one year earlier, at 0.37 °C. This month-on-month cooling occurred despite the apparently emerging 2012-2013 El Niño.
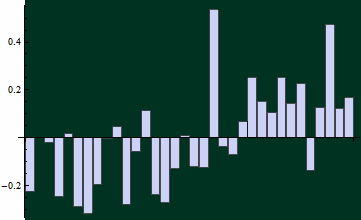
This is the barchart of the average temperature in the first 7 months of the years 1979-2012.
You may see that 2012 had the 6th highest average. If you want the table, here it is:
- {1998, 0.53}
- {2010, 0.47}
- {2005, 0.25}
- {2002, 0.25}
- {2007, 0.23}
- {2012, 0.17}
- {2003, 0.15}
- {2006, 0.14}
- {2009, 0.13}
- {2011, 0.12}
- {1991, 0.11}
- {2004, 0.11}
- {2001, 0.07}
- {1988, 0.05}
- {1983, 0.02}
- {1995, 0.01}
- {1980, 0.00}
- {1987, 0.00}
- {1981, -0.02}
- {1999, -0.04}
- {1990, -0.06}
- {2000, -0.07}
- {1996, -0.12}
- {1997, -0.12}
- {1994, -0.13}
- {2008, -0.14}
- {1986, -0.20}
- {1979, -0.23}
- {1992, -0.24}
- {1982, -0.25}
- {1993, -0.27}
- {1989, -0.28}
- {1984, -0.29}
- {1985, -0.31}
0 comments:
Post a Comment